Product Insights

Shipping Performance
Shipping performance is a critical metric for logistics and supply chain management, encompassing various factors that contribute to the efficiency, reliability, and effectiveness of shipping operations.
- Order Dashboard : Order based analytics based on service, client, store, weight-segments, distance segments etc.
- Order-Quote Dashboard : Analytics to compare quote and order based on various segments like service, client, store, weight segment, distance segments.
- Open Orders Analysis Dashboard : Analytics dashboard directly focusing on pending orders, helping operations to carry out delivery on time.
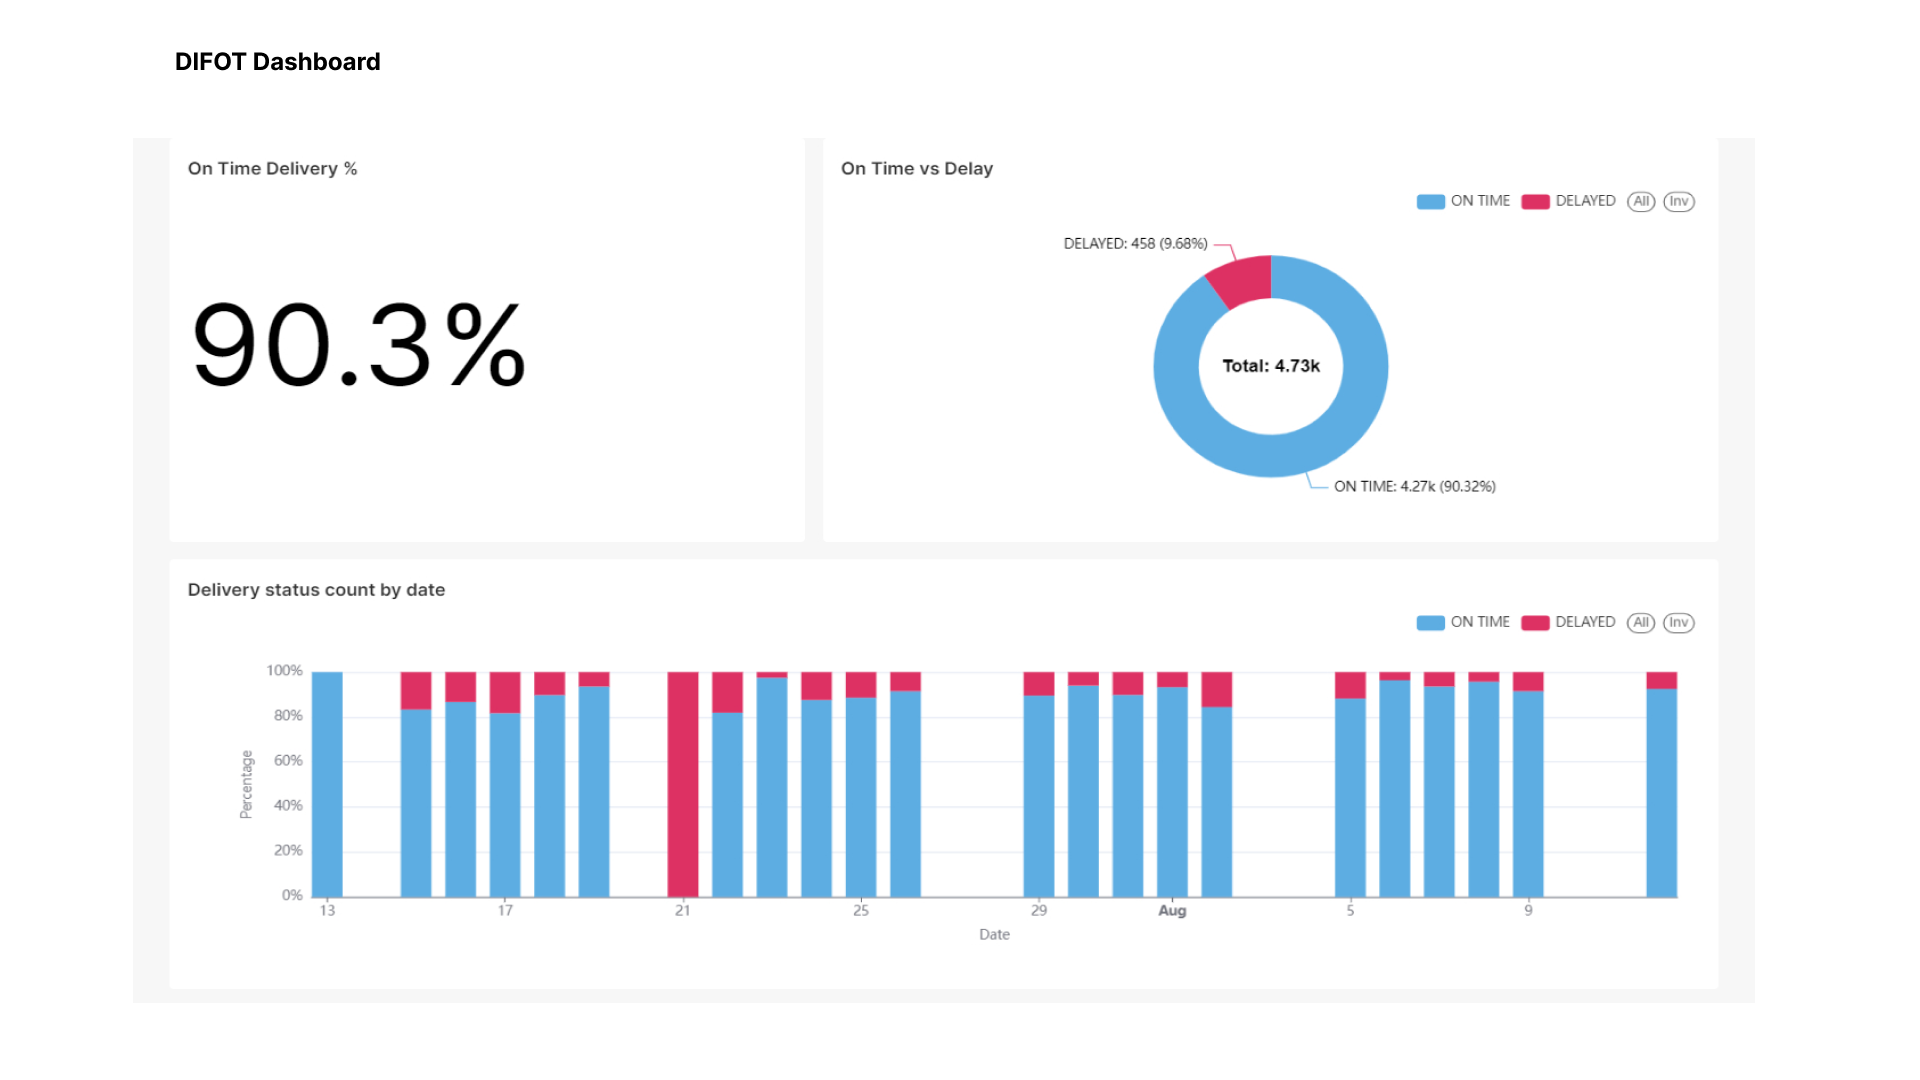
- DIFOT Dashboard : Delivery in full on time report to analyse the on-time delivery efficiency.

Location Insights
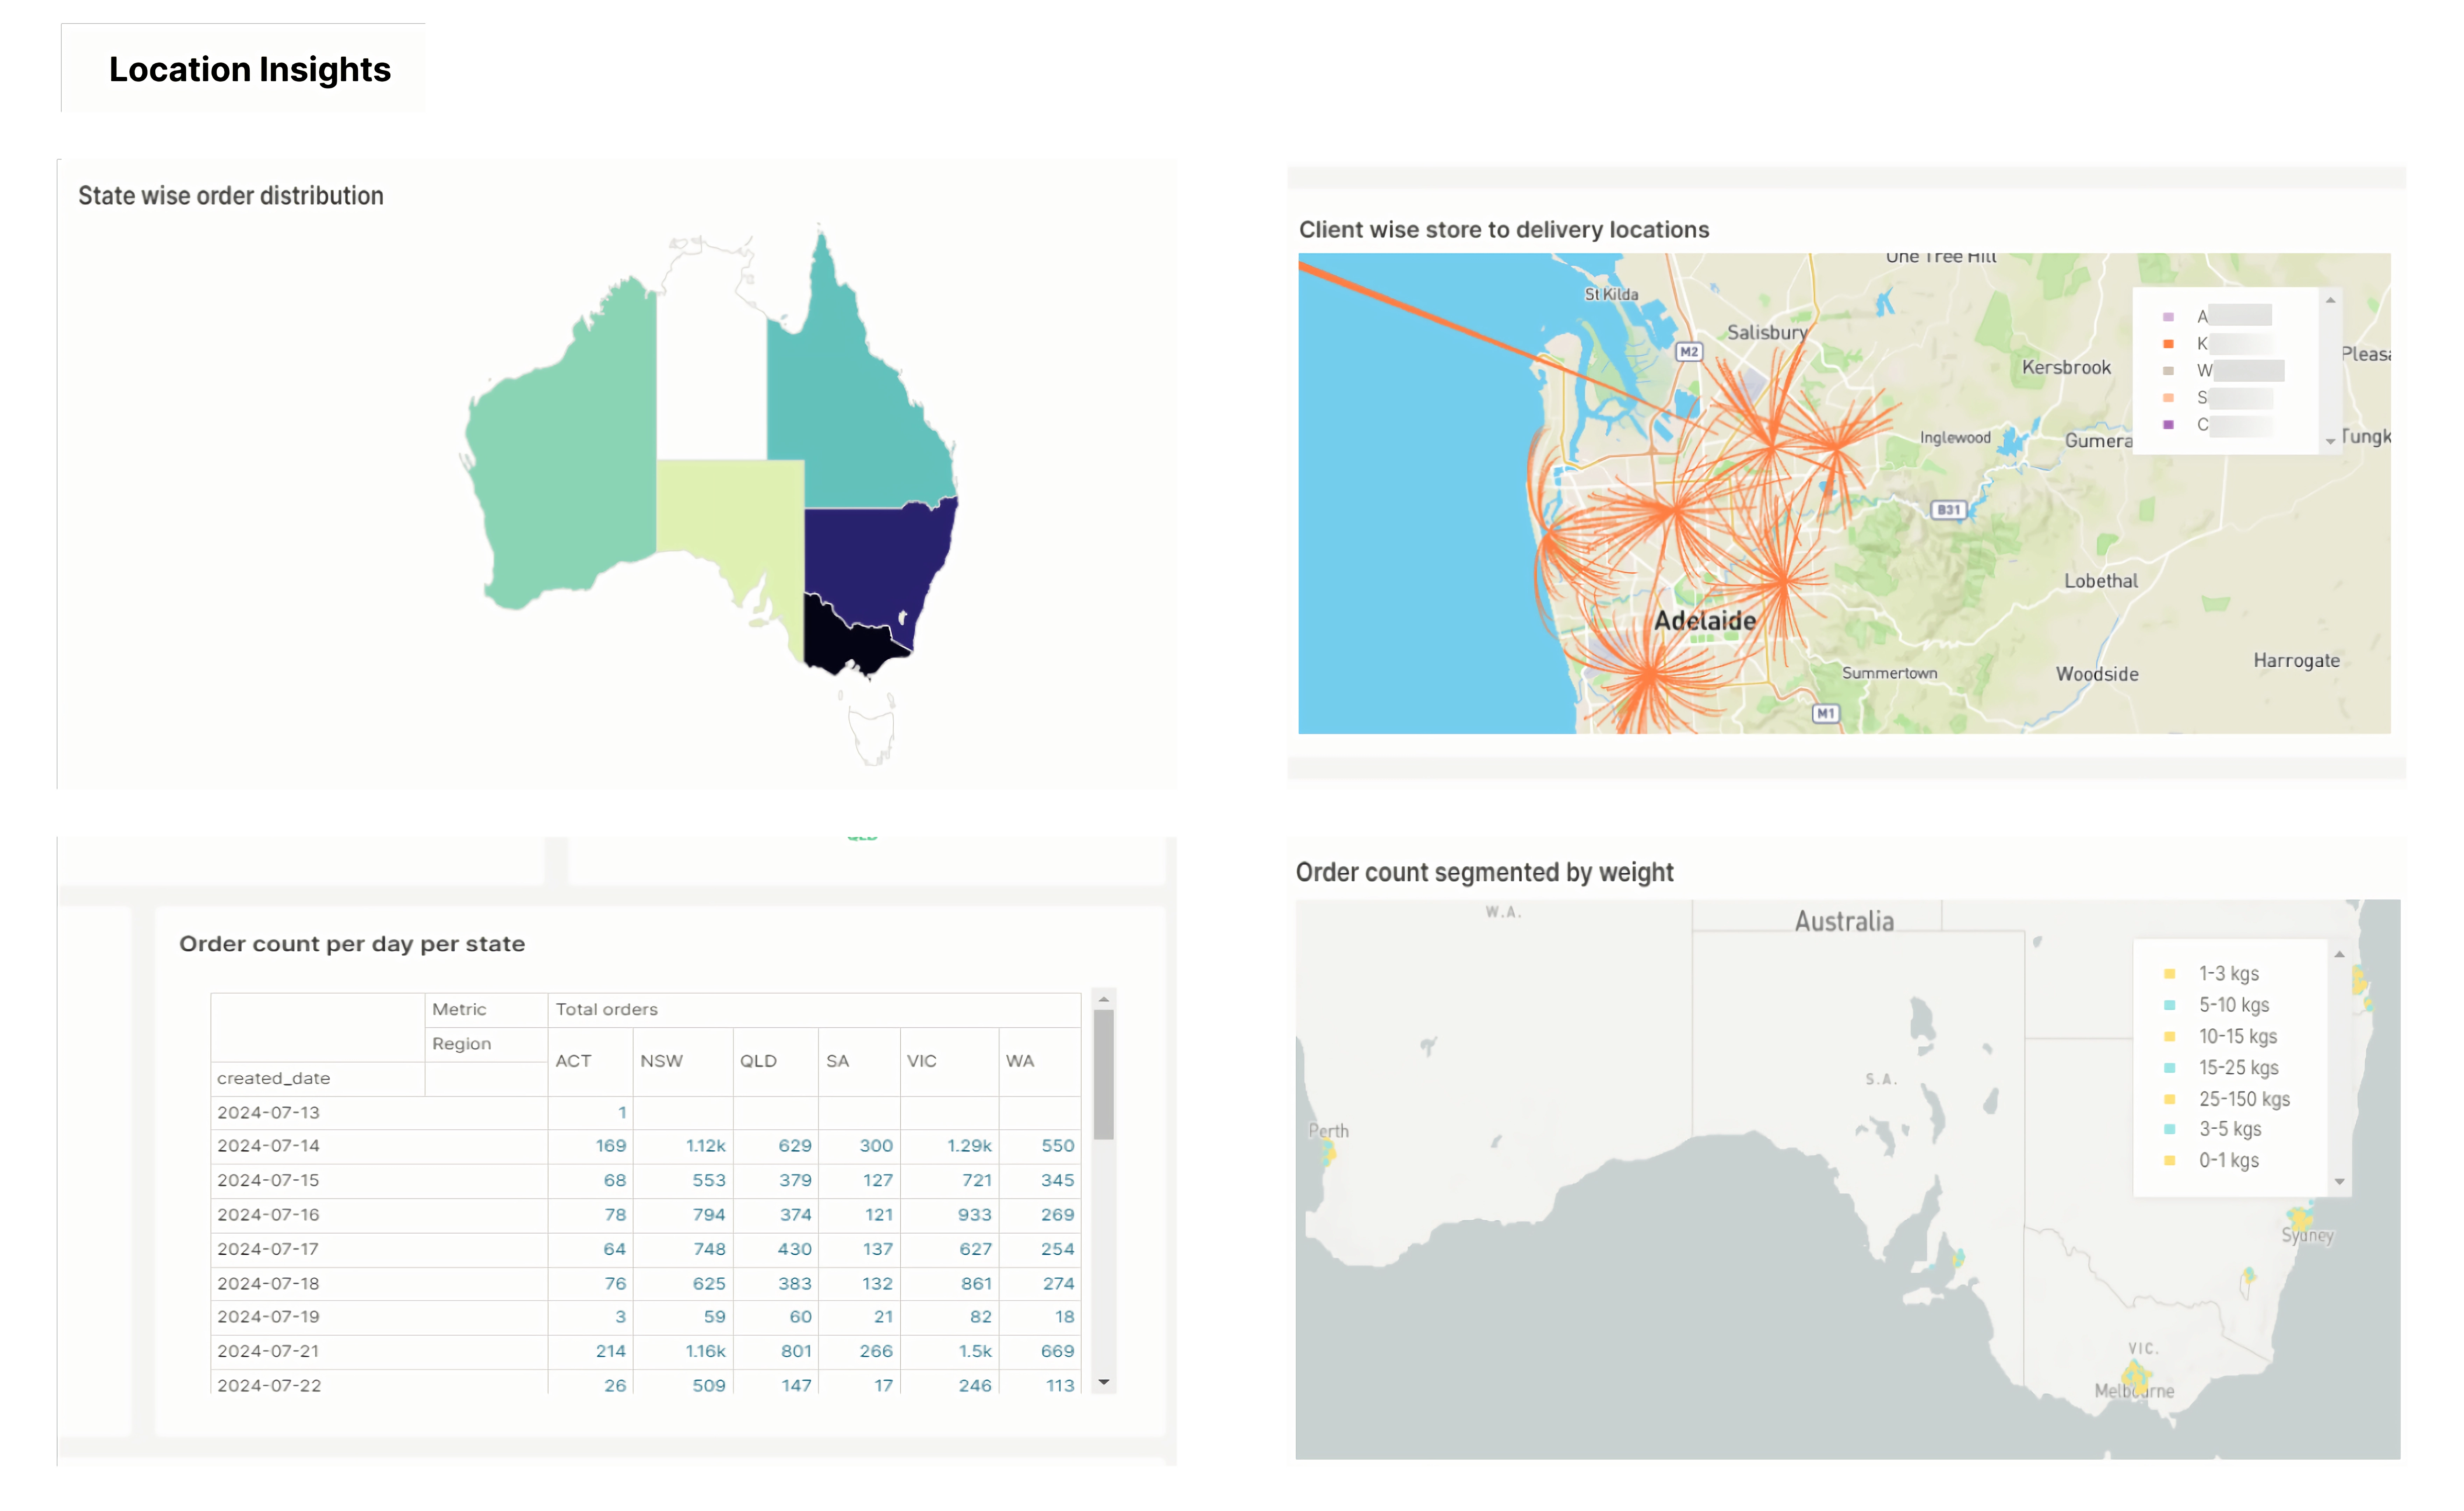
Location insights refer to the use of location data to understand and analyze patterns, behaviors, and trends related to physical locations. These insights can be crucial for various applications, from improving business operations to enhancing customer experiences.
- Order Map Dashboard : Order analysis based on state, store location and delivery location.
- Geographic Visualization : Displays orders on a map, showing their geographic locations. This can be visualized through markers, pins, or heat maps.
- Order Density : Uses color-coding or density maps to represent the concentration of orders in different States.
- Status Markers : Visualizes the current status of orders (e.g., pending, in transit, delivered) with different colours or icons on the map.

Profitability Analytics
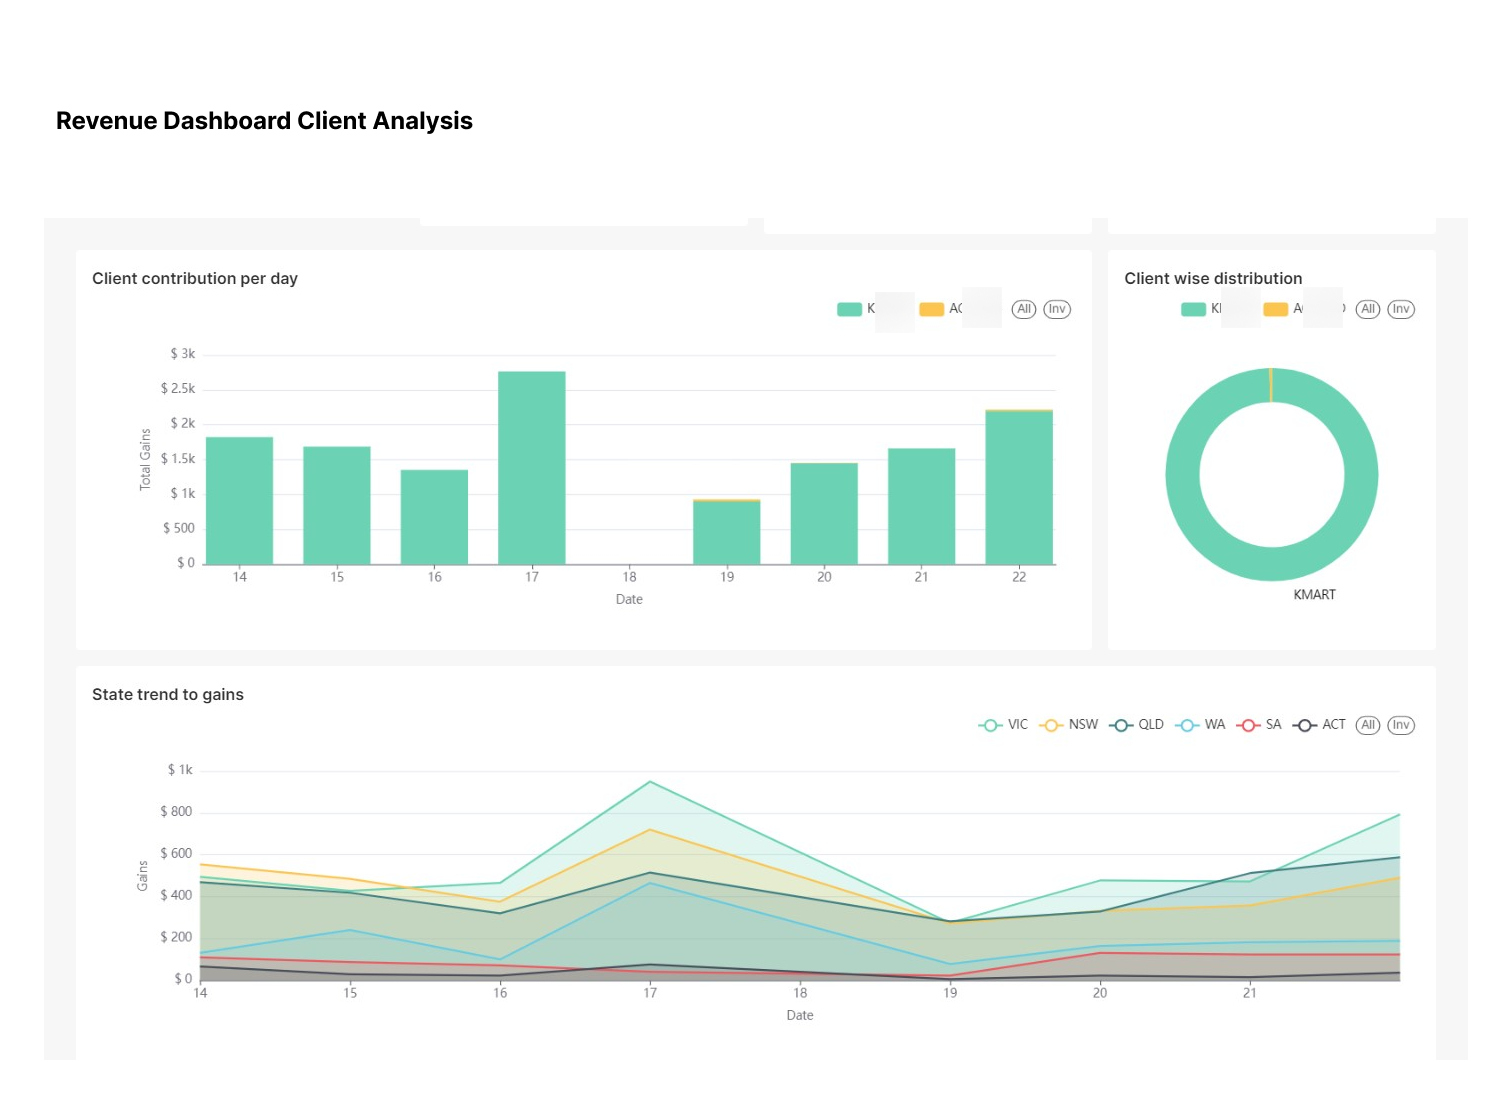
We provide Profitability analytics insights involving analysing various aspects of a business's financial performance to understand, measure, and enhance profitability. This type of analysis helps organizations identify profitable areas, uncover inefficiencies, and make informed decisions to boost their bottom line.
- Revenue Dashboard
- Total Revenue : Displays the total revenue generated over a specific period (e.g., daily, monthly, quarterly, annually).
- Revenue Growth Rate : Measures the percentage increase or decrease in revenue compared to previous periods.
- Revenue by Product/Service : Breaks down revenue by different products or services to show which offerings are most profitable.

Driver Behavior Analysis
Driver Behavior Analysis
OneTracker Driver Behaviour Analysis involves evaluating various aspects in efficiency, and operational performance.
- Dashboard to analyse the performance of the drivers based on their delivery rate, number of deliveries completed etc.

Consumer feedback
Consumer feedback
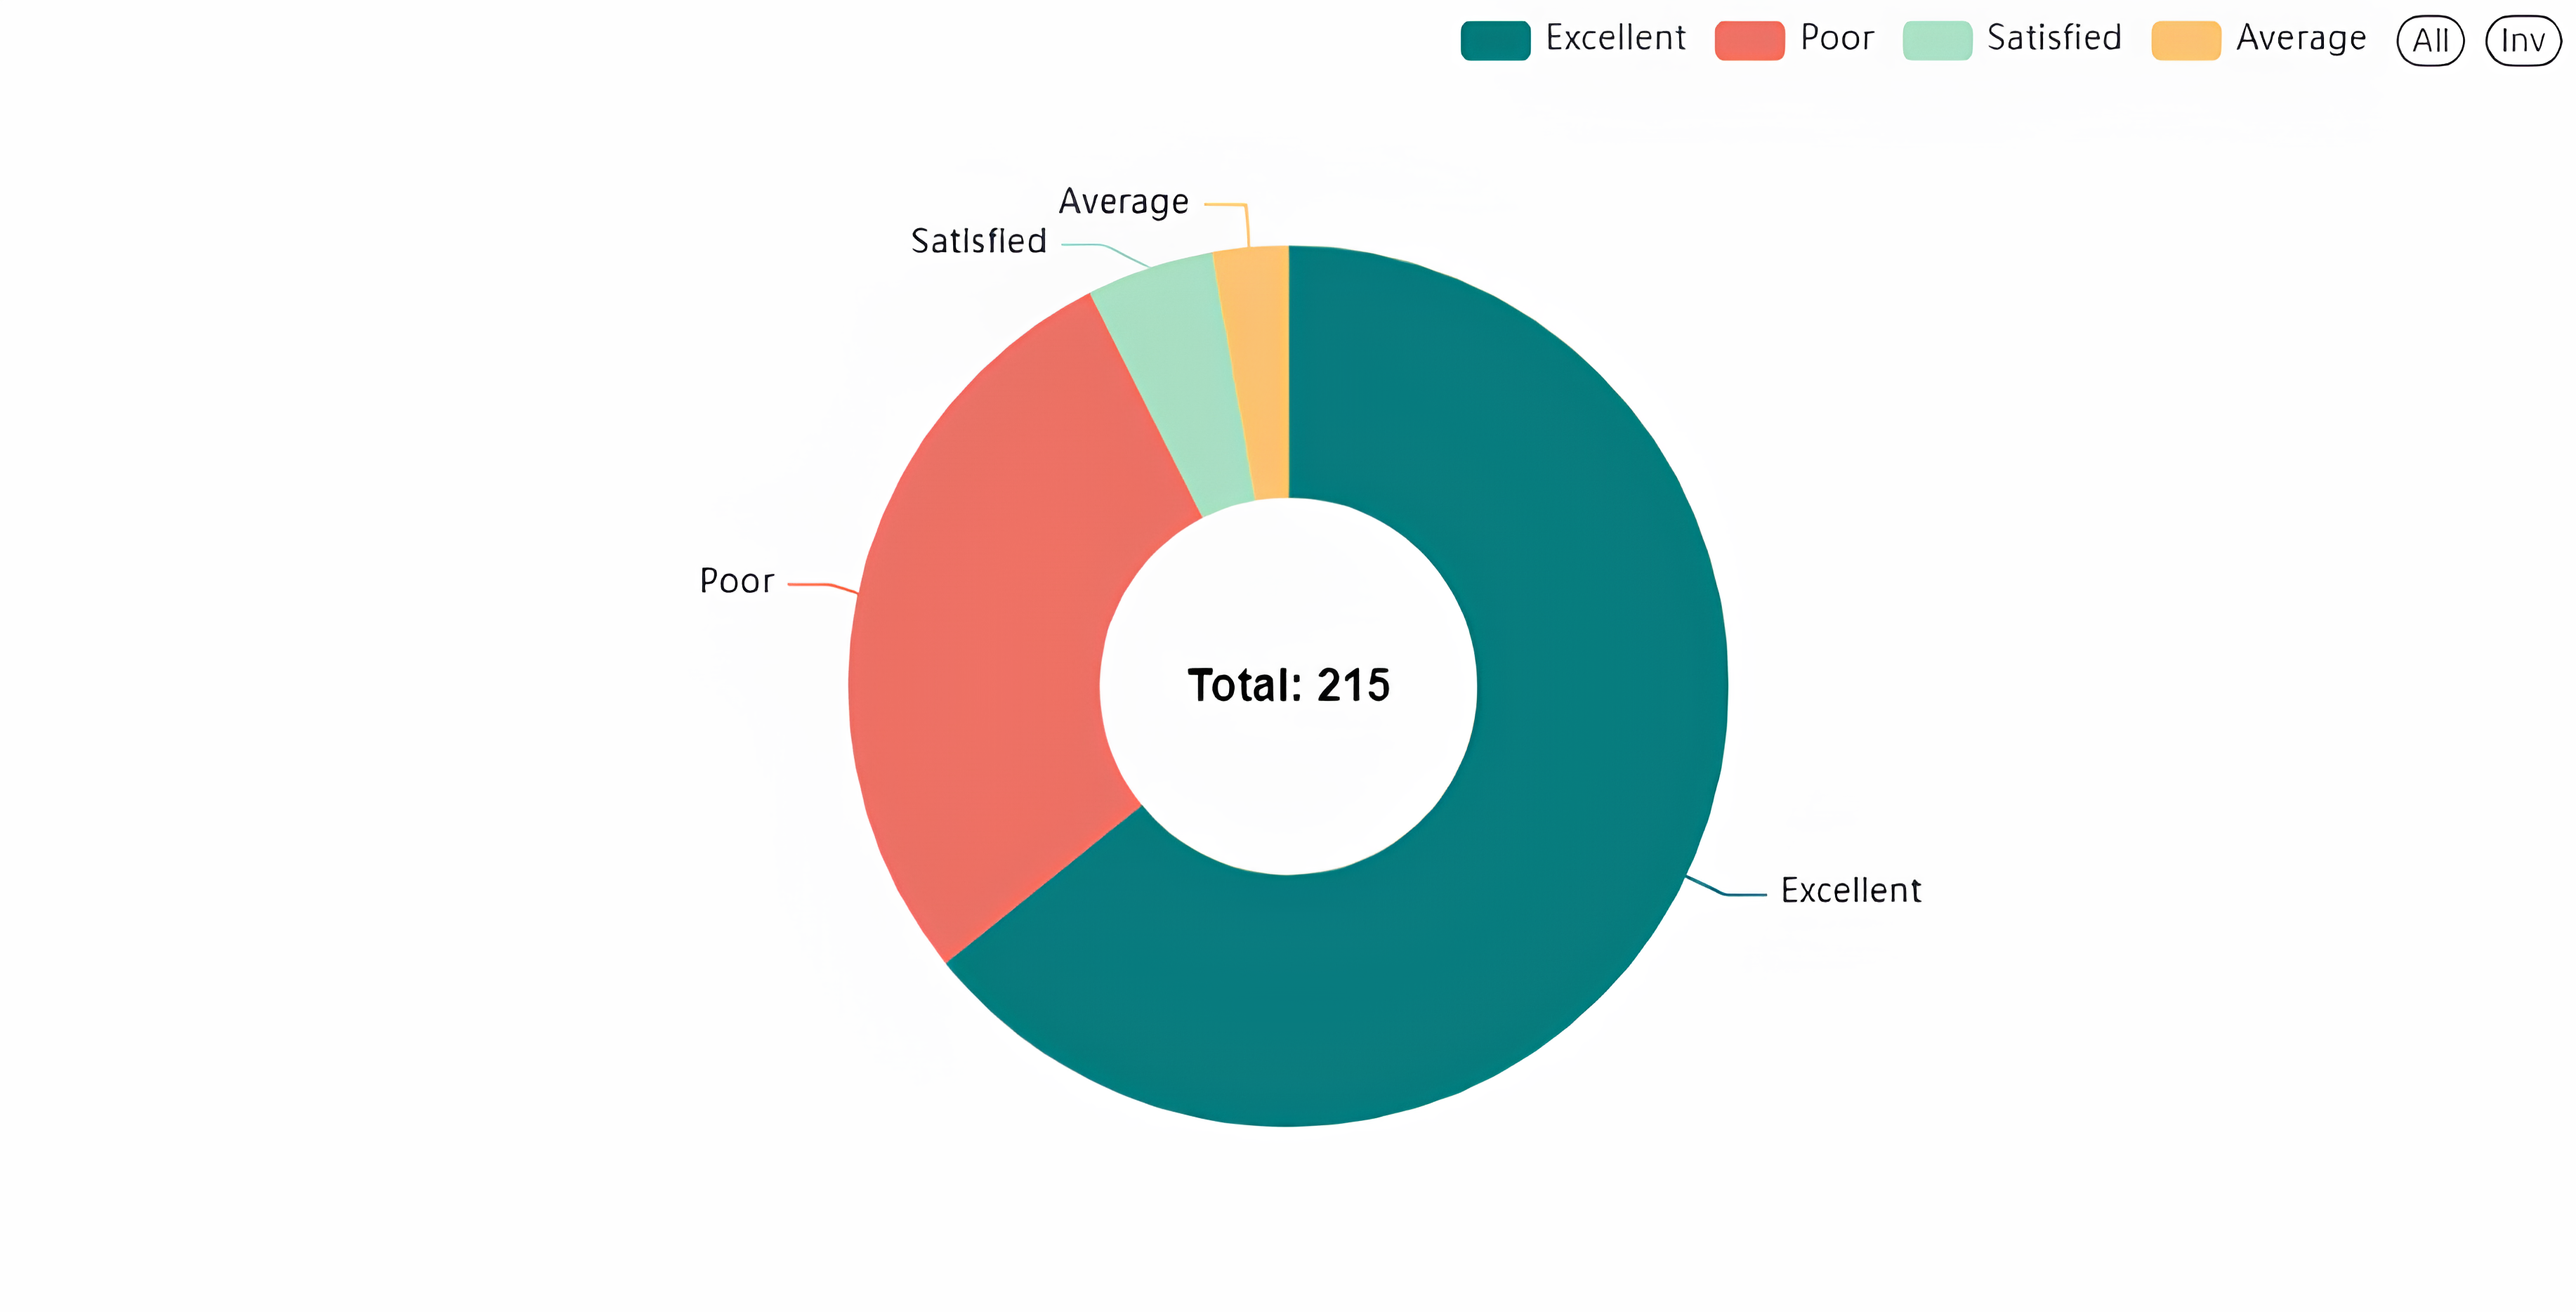
OneTracker Consumer feedback insight involves analyzing feedback from customers to understand their experiences, preferences, and issues. This analysis helps businesses improve their products, services, and overall customer satisfaction.
- Dashboard to analyze the performance of the overall all shipping experience and driver’s feedback.
Copyright © 2025 Onetracker Technologies Pvt. Ltd.